
According to researchers Beverly Kaye and Sharon Jordan-Evans, it costs between 70-400% of an employee's annual salary when an organization loses the employee and has to replace them.
Source: Beverly, K. & Jordan-Evans, S. (2015), "Hello Stay Interviews, Goodbye Talent Loss."
This article gives you an introduction to Woba's Financial Impact, as well as elaborates on how its functions and data should be used and understood. The following points are covered in the article:
- Introduction
- Overview
- The calculator
For questions regarding data, calculations etc. Julian Raymond Blok can be contacted directly at jr@woba.io.
Introduction
What is Financial Impact?
%20(350%20%C3%97%20250%20px).svg) Financial Impact is a tool for estimating how many employees will leave the company within the next 12 months and to estimate the financial exposure if this happens.
Financial Impact is a tool for estimating how many employees will leave the company within the next 12 months and to estimate the financial exposure if this happens.
The forecast is partly based on the employees' responses to a survey and partly based on the values entered into Financial Impact's calculator. This will be further elaborated later in the article.
In most of Woba's surveys, employees are asked the following question:
"How likely is it that you will resign from your job within the next 12 months?"
The employee answers this question on a 5-point scale from Very likely to Very unlikely.
Woba transforms these qualitative answers into quantitative data that can be used to provide a Financial Impact.
In addition, an industry benchmark is also calculated, estimating how a comparable company in the same industry would fare.
The process from an employee providing their response to a survey to Financial Impact providing an estimate is shown below.

What is the cost of losing an employee?
.svg)
The costs of replacing an employee include search costs (such as job ads, external recruiters, and external tests), onboarding costs (such as low productivity, formal training, and onboarding programs), and disruption costs (such as loss of productivity because other workers couldn't perform their usual tasks while providing informal training to new hires).
Empirical research reports that it costs around 16 weeks of an employee's gross salary to replace the employee (or about 30% of the employee's annual salary) across roles and industries, but with an upper limit of 22 weeks (or 42%) of annual salary for knowledge-intensive work such as software engineering and a lower limit of 10 weeks (or 19%) for manual work such as retail. However, according to the research, the indirect costs associated with hiring a new employee make up the largest part of the price:
"The main components of hiring costs are post-match hiring costs, resulting from the initial low productivity and formal training needed for a new hire (53%), and disruption costs, resulting from the informal instruction of a new hire (26%). Pre-match hiring costs (i.e., search costs) account for just 21% of a firm’s hiring costs."
Source: Muehlemann, S. & Leiser, M. S. (2018). "Hiring costs and labor market tightness"
Woba sets replacement costs to a percentage within the 20-40% range, depending on a company's industry. A company can increase/decrease the acquisition costs depending on their specific business circumstances.
It should be noted that the 20-40% range used by Woba is conservative. For example, empirical research from Gallup reports:
“The cost of replacing an individual employee can range from one-half to two times the employee's annual salary.”
Source: Gallup. McFeely, S. & Wigert, B. (2019). "This Fixable Problem Costs U.S. Businesses $1 Trillion"
The reason for the difference is that Woba focuses on direct costs (such as search costs) and not indirect costs such as loss of revenue (for salespeople), delayed product launches (for software engineers), inability to meet customer commitments (e.g. consultants) and other indirect costs that arise when an employee leaves.
How does Financial Impact work?
Financial Impact provides two different methods for calculating the cost of losing an employee.
 Standard-cost calculation
Few variables = Get an estimate quickly
Variables: Average annual salary in the company; Average costs of replacing an employee. Custom-cost calculation
Many variables = Get a higher accuracy of the estimate
Variables: Job level for each employee (entry, mid, senior); Costs of replacing an employee at each job level; Employee salary at either company, department, or employee level.
Both methods convert employee survey responses into data that, along with the above variables and standard values, can be used to calculate an estimate of the cost of losing an employee.
Woba seeks to use reasonable standard values for the variables using reliable sources (such as the Danish Employers' Association and Statistics Denmark), but a customer can of course change the variables to something that better suits their company.
Tip: you can read more about how to fill out the data fields used for Financial Impact here: → Fill out data for Financial Impact
Overview
Data in Financial Impact
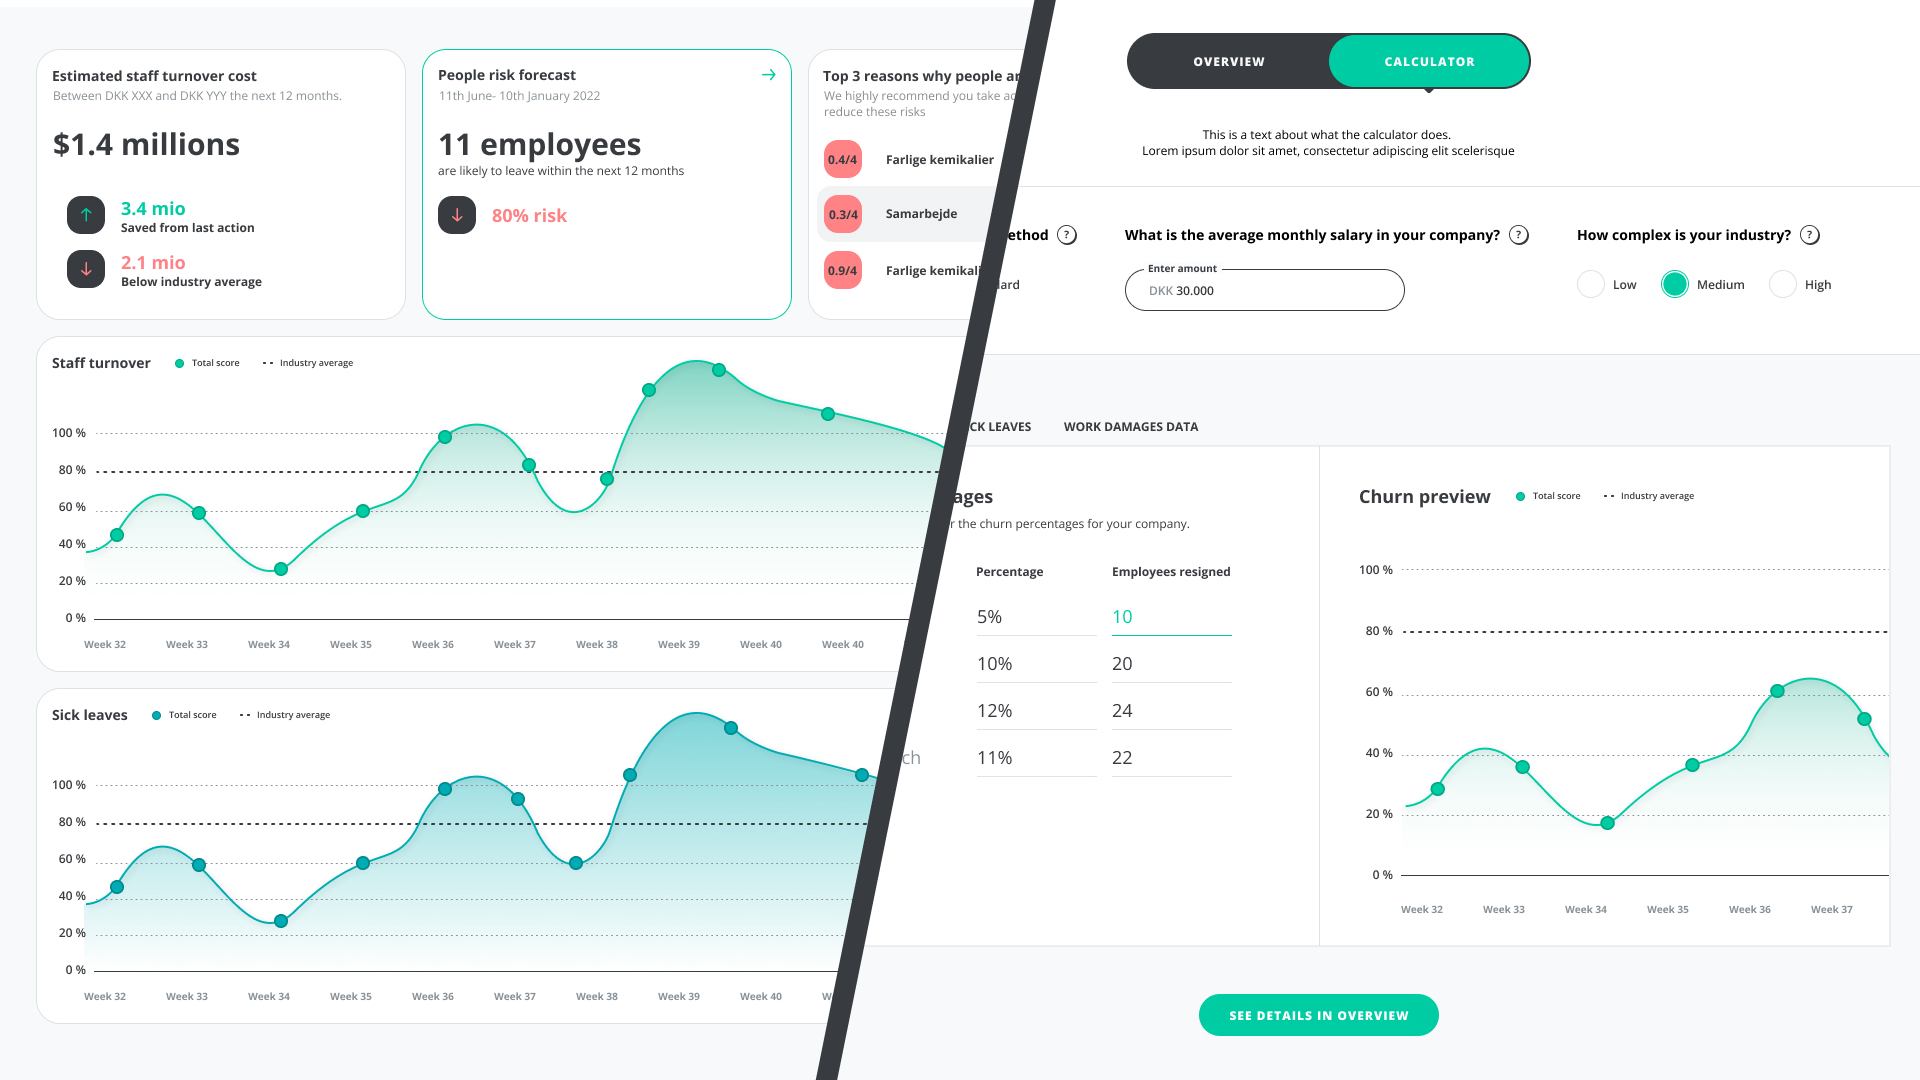
On the front page of Financial Impact, an overview of numbers and graphs is presented based on the data from your survey and the information you have entered into the calculator. These numbers together make up your company's Financial Impact, which aims to predict the number of employees who will leave within the next 12 months and estimate the financial exposure if they do. This is shown based on 2 different estimates, as well as recommendations based on your company's results.
- Estimated staff turnover costs: provides a 90% confidence interval for the costs associated with losing employees over the next 12 months. These costs may include recruitment, training, productivity loss, and other direct factors that impact the company's finances. This figure is linked to the employee risk forecast and can be used to provide a more complete picture of the potential costs associated with employee turnover. By understanding and monitoring these costs, the company can take proactive steps to reduce turnover and improve its bottom line.
-
Employee risk forecast: provides a 90% confidence interval for how many employees are at risk of leaving within the next 12 months. The forecast can help identify and address risk factors that can affect employee well-being and engagement, thus reducing the chances of them leaving the company.
- Top 3 reasons why employees are leaving: highlights the 3 biggest risks from your survey that may be causing employees to quit. Improving these areas in particular can help retain employees and avoid increased staff turnover costs. You can click on each category to be taken directly to the Risk Map, where you will find detailed information about the underlying factors contributing to the score. In the Risk Map, you can create action plans and access research-based recommendations for the area.
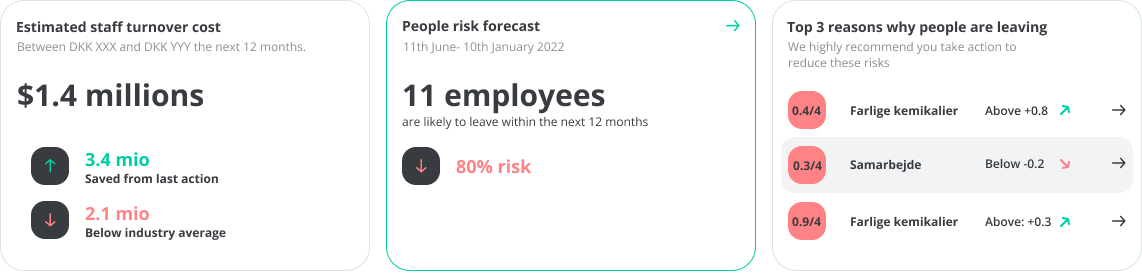
At the bottom of the overview, graphs are displayed based on turnover data, sick leave, work-related injury cases, and cases of loss of earning capacity, if this information has been entered into the calculator. The graphs can be used to provide an overview of the development over time in each category, as well as for comparison with an industry benchmark.
Tip: You can read more about how to interpret the data in Financial Impact here: → Reading the data in Financial Impact
The calculator
Calculation methods
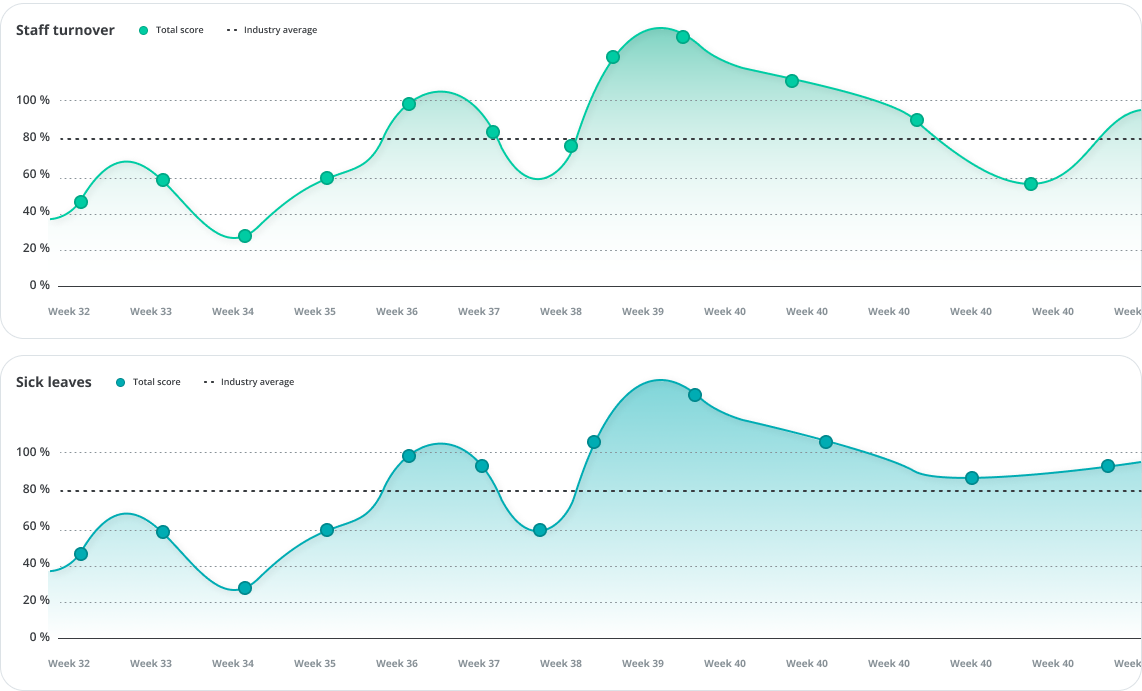
Financial Impact uses two different calculation methods that you can choose from: standard-cost calculation (SSC) and custom-cost calculation (CCC). The difference between the two methods is that SSC uses fewer variables, which provides a faster but less accurate estimate. In contrast, CCC uses many variables, which makes it more demanding but also provides a more accurate estimate.
Standard-cost calculation
When selecting Standard in Choose Cost Calculation Method in Financial Impact, SCC is used to calculate the costs of losing an employee and replacing them with a new one.
The purpose of SCC is to provide a forecast quickly, as there are few fields to fill in for a company (where there are default values), but at the expense of potentially reduced accuracy. For large companies, the law of large numbers increases the accuracy of SCC, but smaller companies should be aware of the uncertainty in the Financial Impact.
Tip: You can read more here: → Standard-cost calculation
Custom-cost calculation
When you choose Custom in Choose Cost Calculation Method, CCC is used to calculate the costs of losing an employee and replacing them with a new one.
CCC allows a company to add job levels (e.g. entry-level, mid-level, and senior-level) to each employee and then specify the costs for each level. The reason is that even in a software company, for example, it may be cheaper to replace a Junior Software Engineer than a Senior Software Architect.
In addition, it will also be possible to specify an annual salary per employee (if sharing such personal information is acceptable to the company) or alternatively to specify the salary at the department level (to make it anonymous), or just continue to use an average for the entire company.
Tip: You can read more here: → Custom-cost calculation