
This article is a guide on how we measure and calculate data from surveys in Woba, as well as how to understand the different scales. The following scales are elaborated:
There are three different scores that are measured in Woba Analytics. The total score, a score based on the answer distribution and Employee Net Promoter Score. This article will explain and elaborate how these should be interpreted.
For questions regarding data, calculations etc. Julian Raymond Blok can be contacted directly at jr@woba.io.
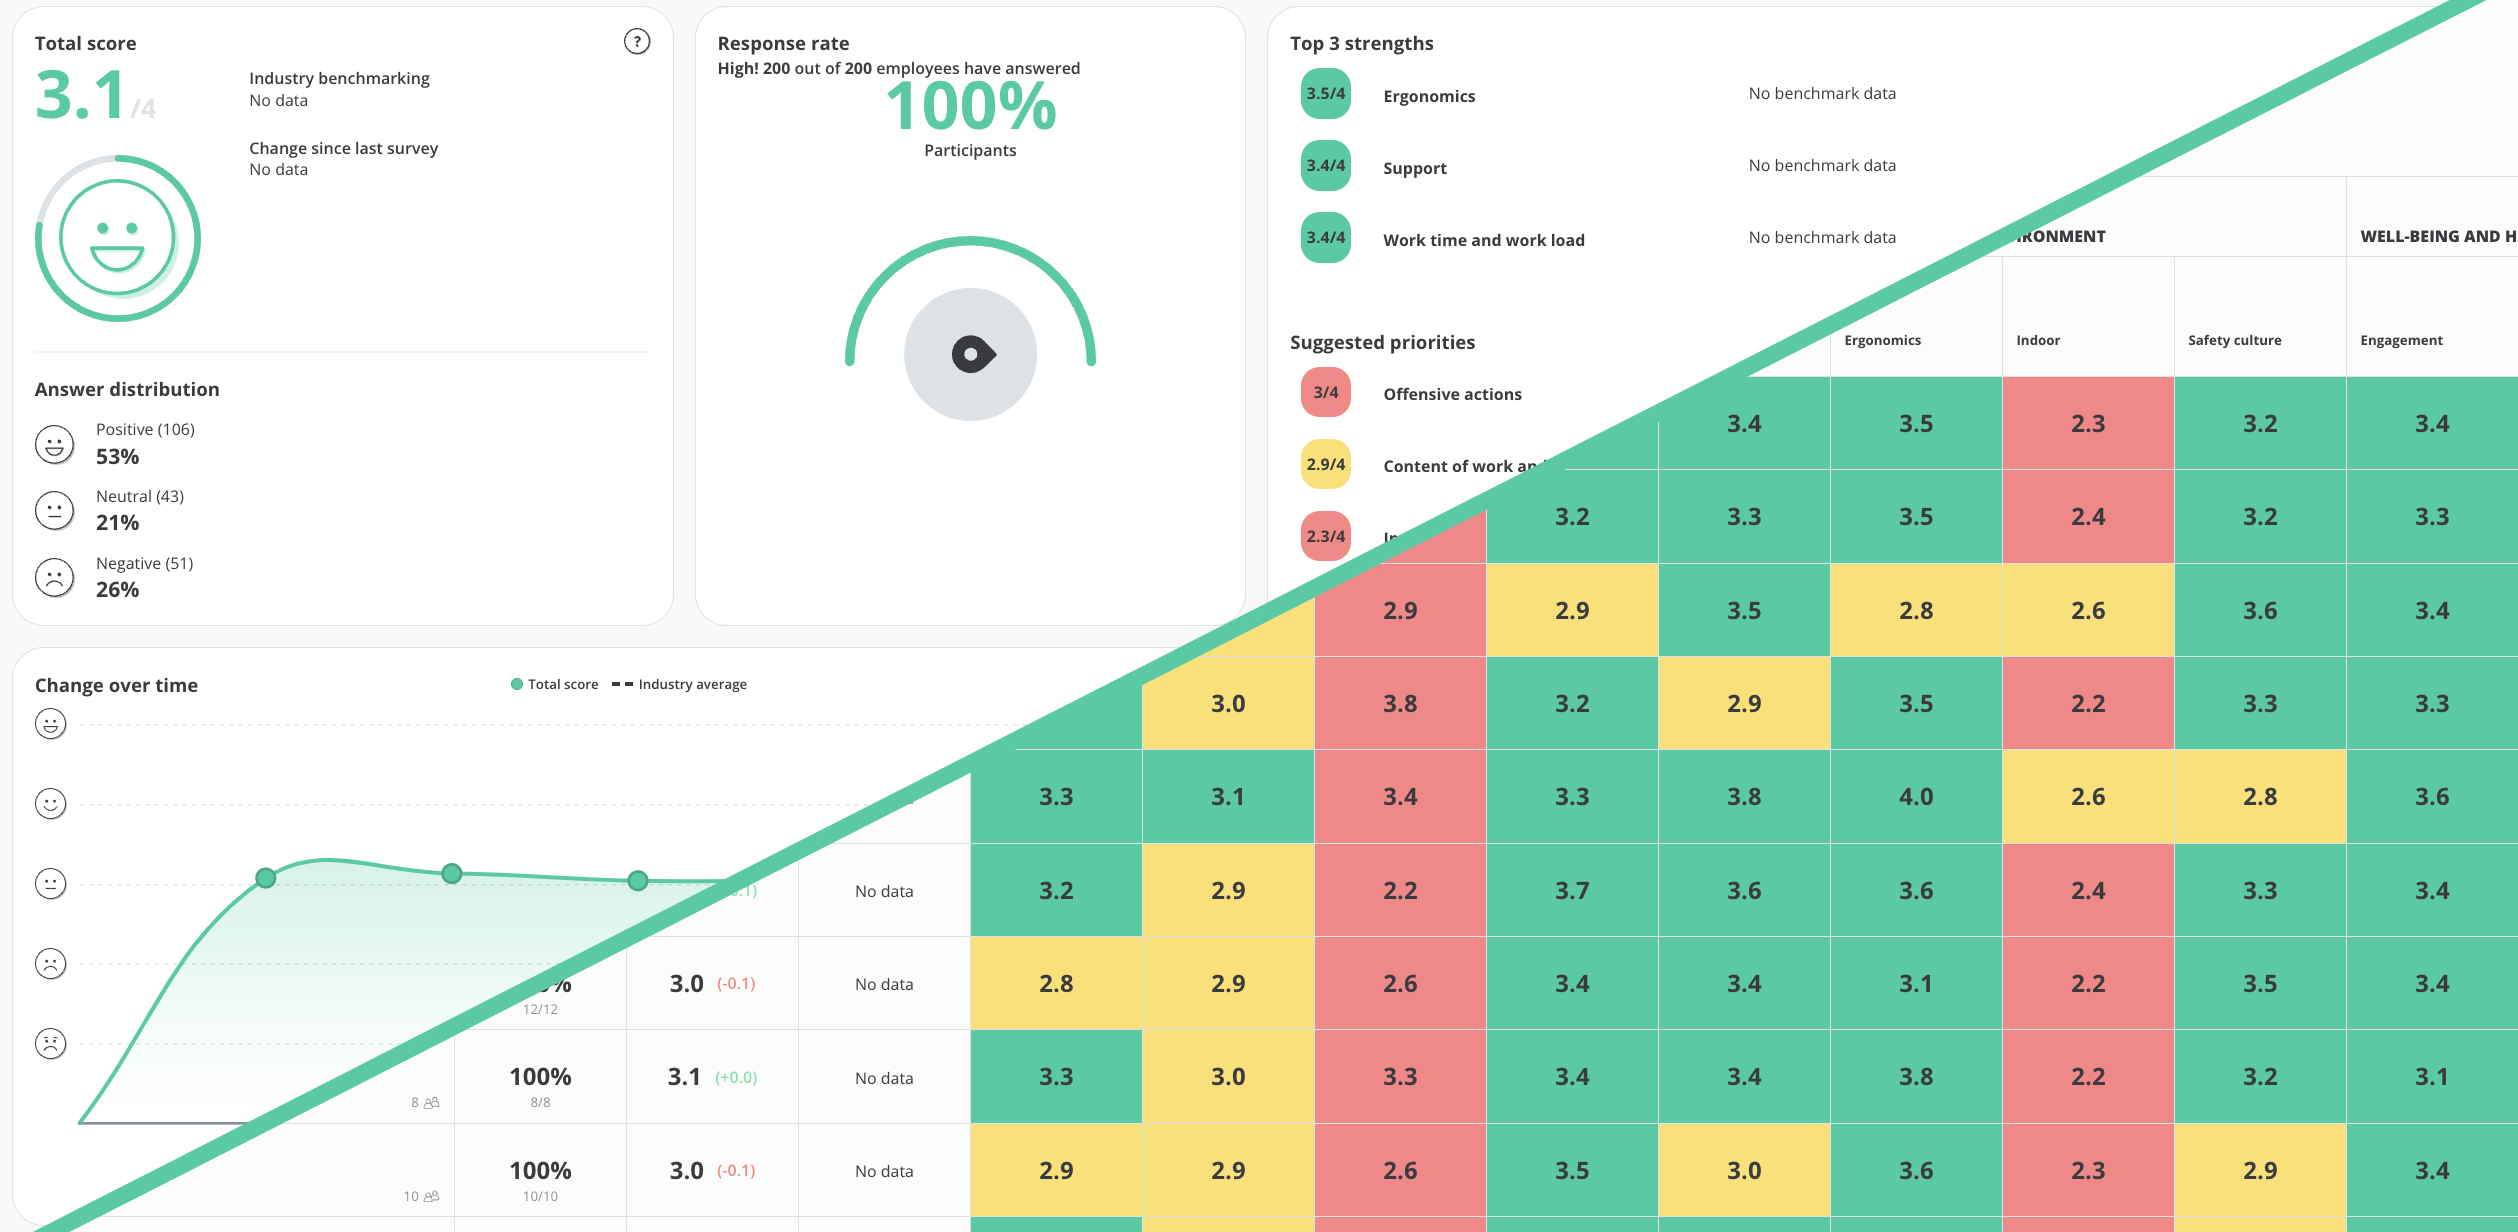
Total score
The results in Woba aim to give you an overview of the employees' answers. The overall result Total score is displayed as a color-coded smiley with an associated scale. This scale normally goes from 0 to 4 and is based on Woba's 5-point scale. However, it is also possible to do eNPS surveys in Woba, where the scale ranges from -100 to +100. You can read about eNPS further down in this article. Additionally, you can also use a rating scale that ranges from 0 to 10.
5-point scale
When employees answer a survey, they can choose between 5 different smileys, each of which is associated with a value from 0-4. The value 0 corresponds to the angriest smiley and 4 to the happiest smiley, etc. The score will be rounded up or down depending on which is closest. For example, 2.95 would be rounded to 3.0, while 2.445 would be rounded to 2.4.
The scale is calculated based on the following smileys:

From these smileys, an average Total score is calculated, which is then displayed as one of three smileys, based on the following average values:
😫 Red 0-2.5 😐 Yellow 2.6-3.0 😁 Green 3.1-4.0


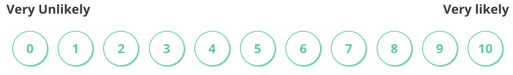
11-point scale
When employees respond to a survey with an 11-point scale, they can choose from 11 different numbers ranging from 0 to 10. Here, 0 corresponds to the unhappiest emoji, and 10 to the happiest emoji, and so on. 
Based on these emojis, an average Total score is calculated, which is then displayed as one of three emojis, based on the following average values:
😫 Red 0-3 😐 Yellow 4-6 😁 Green 7-10
The above distribution is normative limit values, which aim to nudge the manager, HR, working environment committee and other relevant actors to act on the current results.
This also means that it is easier to fall into the red and green categories than the yellow category, as the first two categories indicate when something works as a resource or as a risk. It is especially risks and resources that are essential to prioritize, in order to be able to act proactively on topics that have an impact on employees' well-being.
The green category Strengths should be interpreted as positive resources that promote employees' happiness and productivity at work.
The yellow category Watch out for indicates that there are conditions in the workplace that should be kept an eye on.
The red category Priorities indicates that there are most likely conditions at the workplace or in the work that the employees are dissatisfied with.
Tip: You can see how to get research-based recommendations for your company's risk areas here: → Get recommendations
Answer distribution
The score shown in the Answer distribution is solely based on the number of employees who have responded positively, neutrally or negatively.
An employee has answered positively to a question by choosing one of the two happy smileys ![]() , neutrally by selecting the neutral smiley
, neutrally by selecting the neutral smiley  , and negatively by choosing one of the two sad smileys
 ![]() .
.
All the answers from each employee in a survey are divided into the three categories. This means that an employee's positive, neutral and negative responses distributed between all the questions in a survey are added together. Afterward, it is possible to see how large a part of the total answer distribution for an employee that consists of positive, neutral, and negative answers. If positive answers take up the largest part, the employee's survey answer will be counted as positive in the answer distribution. Questions that are skipped are not included in the answer distribution.
The number in parentheses that appears next to the percentage shows the number of employees in each group of responses. The distribution of responses is therefore only based on submitted responses and has nothing to do with people who have not answered the survey.
Below is an example of how the answer distribution for a survey with 200 responses can be interpreted:
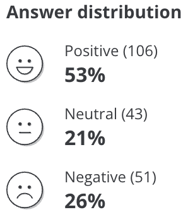 In the answer distribution in the picture, 51% (equivalent to 103 employees) have a positive answer and therefore gave the most questions one of these two smileys:
 ![]()
Next, 20% (equivalent to 41 employees) have a neutral answer and therefore gave the most questions this smiley: ![]()
Finally, 28% (equivalent to 57 employees) gave a negative answer and therefore gave most questions one of these two smileys: ![]()
Note: the answer percentage and the underlying figures for the calculations in the answer distribution have been rounded to make the overview easier to read. Therefore, it is not always that the percentages add up to 100% or the number of employees in the brackets add up to the number of responses in a given survey.
Employee Net Promoter Score (eNPS)
7 and 8 = Passives: This group of employees is often not particularly committed and could be looking for a new job if the opportunity arises.
0 to 6 = Detractors: Are not very satisfied with the company and their job. There is a risk that they have a negative impact on colleagues and customers.

A score in the interval -1 to -39 is shown as a yellow neutral smiley:
A score in the interval -40 to -100 is shown as a red angry smiley:
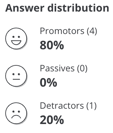 The answer distribution for eNPS surveys looks different in the Woba overview than in other surveys. In the overview for eNPS you can see the distribution of the aforementioned promoters, passives, and detractors. In the example in the picture, this means that 80% (equivalent to 4 people) answered 9 to 10, 20% (equivalent to 1 person) answered 0 to 6 and nobody answered 7 to 8.
Tip: you can read more about the eNPS survey here.